Stockbeep is a stock scanner currently covering 3 markets:
(click to launch)
United States – NYSE and NASDAQ
Canada – TSX, TSXv and CSE
Australia – ASX
For each territory, we track the top 1000 most actively traded stocks, ranked by their 5-day volumes.
Overview
Traders use Stockbeep to discover price events and volume flows during the trading session.
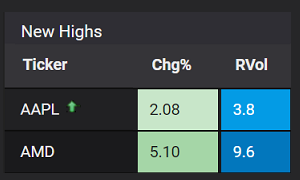
New highs
Price events that traders look out for typically include new highs/lows. These could mean all-time highs or 52-week highs.

It could also mean monthly highs.

The New Highs scan tracks all-time, 52-week and monthly highs, helping traders discover stocks with significant new highs today.

Continuous updates
The scans update every 5 seconds during regular trading hours. To get the latest results for any scan, sort by Time. This will display stocks ranked by the timestamps of their latest highs/lows.

Price breakouts
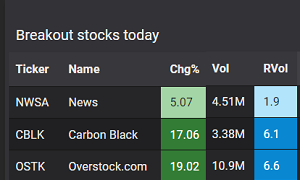
Traders are often on the lookout for “breakout stocks”. These are stocks where prices are showing a sharp upward move.

The Breakout Stocks scanner

The methodology that we use, is the 5-day range. When a stock moves above its 5-day range by one standard deviation, it gets displayed on the scanner.

Volume flows
Traders also look out for increased volume flows. The industry term would be “unusual volume”, “high relative volume (RVol)” or “volume spike”.

Elevated volume flows typically signal that there is something going on today, or that the stock “is in play” today.
The Unusual Volume Stocks scan identifies stocks with increased trading activity today.

Multiple sorting criteria
All scans can be sorted by your preferred criteria.

For example, sorting by Time will display the latest results.
To look for large-cap stocks, sort by Cap.
To look for high volume stocks, sort by Volume.
To look for stocks with high relative volume, sort by RVol.
Other price events and patterns
Gap up stocks – these are stocks with a strong opening and have moved higher beyond the gap. They are also known as “bullish gaps” or runaway gaps”.

Example of a “gap up” stock.

Trending stocks – these are stocks moving upwards over the last 5 days, with a series of higher highs and higher lows.

Example of a stock in a 5-day uptrend.

Stocks moving up now – these are stocks higher within the current 5-minute period. You can sort the data by 5-minute change, % change and volume.

Scanning for losers
To look for stocks with negative price action today, equivalent scans are also available.
(click to launch)
Stocks moving down now
→ Next: Use stock scanners to improve your trading results
About the author
David Miller is the Market Data Engineer at Stockbeep. He has spent more than two decades working across dealing rooms, market data vendors and trading ISVs.
For short term trading, David employs a data-based approach to trade equities and derivatives. For long term investing, he prefers ETFs and fixed income.
Besides helping traders find actionable information from data, he is an avid fan of hockey, golf and fishing.


